你每天早上都会查看 YouTube Studio。那个点击率数字就在那里盯着你:2.1%。你尝试过修改标题,测试不同的上传时间,甚至买了一台更好的相机。但数据依然毫无起色。
这是大多数创作者忽略的一点:90% 的情况下,点击率 (CTR) 低都是缩略图的问题。YouTube 官方的 Creator Academy 指出,90% 的表现最佳的视频都使用了自定义缩略图。而 YouTube 内部数据显示,缩略图和标题共同决定了一个视频 60% 以上的点击表现。
本指南将帮助你准确诊断缩略图到底出了什么问题——不是靠猜测,而是利用顶级创意机构所使用的注意力科学。
第 1 步:对照真实基准检查你的点击率
在诊断之前,你需要知道你的点击率是否真的偏低。“低”是相对于你的领域和频道规模而言的。以下是基于创作者汇总数据和 YouTube 官方博客的基准:
| 领域 | 平均点击率 | 表现优秀的情况... | 需要改进的情况... |
|---|---|---|---|
| 游戏 (Gaming) | 4.5% | 高于 7% | 低于 3% |
| 科技 / 评测 (Tech / Reviews) | 4.8% | 高于 7.5% | 低于 3% |
| 教育 (Education) | 5.2% | 高于 8% | 低于 3.5% |
| 娱乐 (Entertainment) | 5.5% | 高于 9% | 低于 3.5% |
| 美妆 / 时尚 (Beauty / Fashion) | 3.8% | 高于 6% | 低于 2.5% |
| 商业 / 金融 (Business / Finance) | 4.0% | 高于 6.5% | 低于 2.5% |
| 音乐 (Music) | 2.5% | 高于 4% | 低于 1.5% |
重要提示: 还要在 YouTube Analytics 中按流量来源检查点击率。浏览 (Browse/Home) 点击率通常自然低于搜索 (Search) 点击率 (5-12%) 或通知 (Notification) 点击率 (10-20%)。整体点击率“低”可能只是因为你的大部分曝光来自浏览功能。详情请参阅 YouTube 流量来源文档。
第 2 步:进行 5 点缩略图诊断
现在让我们来诊断你的实际缩略图。请按顺序进行每项检查——它们是按影响力排序的。
诊断 #1:眯眼测试(视觉显著性)
在手机上打开你的缩略图。将其保持在一臂距离并眯起眼睛。你还能看出缩略图的主题吗?还能看清文字吗?
这模拟了观众在 YouTube 首页滚动时的场景。你的缩略图在移动端显示约为 168×94 像素——非常小。发表在 Nature Reviews Neuroscience 上的 Itti & Koch (2001) 的研究表明,视觉系统在 100-200 毫秒内就会处理显著性(即什么最“抢眼”),然后意识注意力才会介入。
如果未通过眯眼测试: 说明你的元素太小、对比度太低,或者竞争元素过多。这是点击率的第一大杀手。
诊断 #2:人脸检查
Kanwisher et al. (1997) 发现了梭状回面孔区 (FFA)——这是一个在大脑中能在 170 毫秒内检测到面孔的区域,比任何其他视觉刺激都快。我们的数据显示:
- 带有人脸的缩略图:平均注意力得分高出 47%
- 人脸占据画面的 30% 以上:最佳点击率区间
- 表情丰富(惊讶、兴奋)对比中性表情:点击率提升 52%
检查: 你的缩略图有人脸吗?它是否至少占画面的 30%?表情是否具有高能量?
诊断 #3:文本可读性测试
如果你的缩略图有文字(大多数高点击率缩略图都有),请检查以下几点:
- 字数: 超过 6 个单词/汉字?对于 168 像素的宽度来说太多了。
- 对比度: WCAG 标准要求 4.5:1 的对比度以保证可读性。浅色背景上的白色文字可能只有 2:1——在缩略图尺寸下几乎不可见。使用 对比度检查器 进行验证。
- 字体粗细: 细字体在小尺寸下会消失。请务必使用粗体 (Bold) 或特粗体 (Extra-bold)。
根据 Nielsen Norman Group 的研究,用户花费 50-500 毫秒来评估视觉内容。如果你的文字无法在这个窗口期内被识别,它就是无效的负担。
诊断 #4:竞品对比检查
在 YouTube 上搜索你的目标关键词。截取搜索结果页面的屏幕。现在问问自己:你的缩略图是从中脱颖而出,还是隐没其中?
大脑的习惯化机制 (habituation mechanism) 会主动过滤掉熟悉的模式。如果你所在领域的所有缩略图都使用蓝色背景和白色文字,那么使用相同的颜色会让你变得“隐形”。你需要的是与竞争对手形成视觉反差,而不仅仅是孤立地看设计好坏。
诊断 #5:好奇心缺口检查
发表在 Psychological Bulletin 上的 Loewenstein 的信息缺口理论 (1994) 解释了为什么有些缩略图能吸引点击:当你感知到已知信息与想知道的信息之间存在差距时,就会触发好奇心。
你的缩略图应该提出一个只有点击才能回答的问题:
- “发生了什么导致了那个反应?”(展示反应,而不是原因)
- “他们是怎么得到那个结果的?”(展示结果,而不是方法)
- “这张照片有什么不对劲?”(展示令人惊讶或意想不到的事物)
如果你的缩略图和标题已经揭示了一切,那就没有点击的理由了。
第 3 步:使用数据确认你的诊断
这 5 点诊断为你提供了假设。现在用数据来确认它们。
将你的缩略图上传到 FlowDx 进行 AI 注意力分析。你将获得:
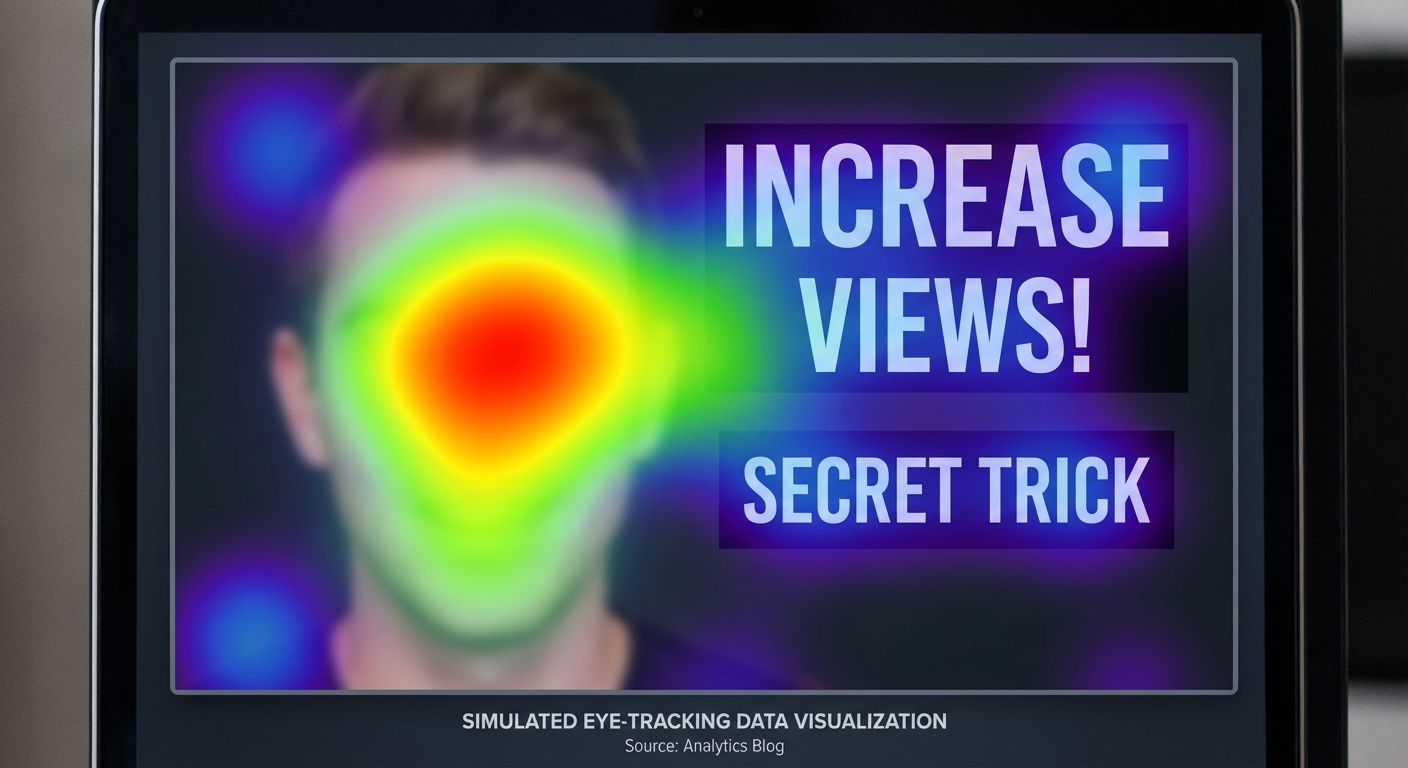
- 注意力热力图 —— 观众视线实际停留的位置。如果热区在背景上而不是在你的脸部/文字上,那么你的问题就得到了确认。
- 五维认知评分 —— 注意力(显著性)、视觉焦点(层级)、情感冲击(好奇心触发)、行动驱动(CTA)、记忆强度(记忆点)。每项评分 0-100,并带有颜色编码的阈值。
- 具体的修改建议 —— 不仅仅是“提高对比度”,而是“你在位置 X 的白色文字与背景的对比度为 2.1:1——请添加深色描边或背景块”。
热力图背后的科学:FlowDx 使用了 DeepGaze IIE,这是在 MIT Saliency Benchmark 上排名第一的显著性模型,与真实人类眼动追踪数据的相关性超过 87%。
第 4 步:修复与验证
根据你的诊断进行更改并重新测试。最常见的修复方案及其典型的点击率影响如下:
| 修复方案 | 典型点击率提升 | 投入精力 |
|---|---|---|
| 将人脸放大至画面的 30% 以上 | +1.5-3.0 个百分点 | Canva 中操作 5 分钟 |
| 增加文字对比度(深色描边/背景) | +0.5-1.5 个百分点 | 2 分钟 |
| 将元素从 7 个以上减少到 3 个 | +1.0-2.5 个百分点 | 10 分钟重新设计 |
| 切换为与首页信息流互补的颜色 | +0.3-1.0 个百分点 | 5 分钟 |
| 增加好奇心缺口(隐藏结果) | +1.0-3.0 个百分点 | 重新构思创意 |
专业提示: 每次只修改一个地方,然后在 FlowDx 中重新测试。这样你就确切地知道是什么提高了分数。
第 5 步:长期跟踪进度
点击率的提升不是一劳永逸的。建立一个系统:
- 发布前: 将每个缩略图通过 FlowDx 运行。目标是五个维度都达到 70 分以上。
- 24 小时后: 检查 YouTube Analytics 中的点击率。如果低于你的领域平均水平,考虑更换缩略图(YouTube 允许这样做且不会受到惩罚,这已在其 官方帮助中心 得到确认)。
- 每月: 比较你的平均点击率趋势。随着你逐渐掌握适合受众的内容,你应该能看到稳步的提升。
常见问题 (FAQ)
更改缩略图会重置 YouTube 算法吗?
不会。YouTube 官方已确认,更改缩略图不会重置曝光量或算法推荐。许多顶级创作者(包括 MrBeast)经常在发布后更换缩略图以优化点击率。事实上,YouTube 自己的 测试与比较 (Test & Compare) 功能正是鼓励这种做法。
高点击率总是好事吗?
如果伴随着低观看时长,则不然。误导性的缩略图可能会骗取点击,但观众会立即离开,这向 YouTube 发出信号,表明你的内容不符合预期。从长远来看,这会损害你的视频。目标应该是高点击率 + 高留存率——一个能激发真实好奇心的诚实缩略图。
每个视频我应该测试多少个缩略图?
YouTube 的“测试与比较”功能允许你同时测试最多 3 个缩略图。请善用它。我们的建议是:制作你认为最好的缩略图,然后制作 1-2 个变体,每个变体只改变一个主要元素(不同的表情、不同的配色方案、不同的文字角度)。先通过 FlowDx 运行所有缩略图,然后让 YouTube 测试最终入围的作品。
同样的缩略图策略适用于 Shorts 吗?
Shorts 缩略图的工作方式不同——它们是从视频本身中选取的,并显示在垂直信息流中。关键因素仍然是人脸、对比度和好奇心,但竞争更加激烈,因为 Shorts 的消费速度更快。Shorts 的第一帧就是你的缩略图。
参考文献
- YouTube Creator Academy. Thumbnail best practices.
- YouTube Official Blog. Understanding click-through rate.
- Itti, L., & Koch, C. (2001). Computational modelling of visual attention. Nature Reviews Neuroscience, 2(3), 194-203.
- Kanwisher, N. et al. (1997). The fusiform face area. Journal of Neuroscience, 17(11), 4302-4311.
- Loewenstein, G. (1994). The psychology of curiosity. Psychological Bulletin, 116(1), 75-98.
- Linardos, A. et al. (2021). DeepGaze IIE. ICLR 2021.
- MIT Saliency Benchmark. saliency.mit.edu.
- Nielsen Norman Group. How Long Do Users Stay on Web Pages?
- WebAIM. Contrast Checker.